
Why Opta Player Stats Changed Everything About Football
Do you remember when football analysis was just about counting goals and making educated guesses? Those days are a distant memory. The arrival of detailed Opta player stats has fundamentally changed how we see the beautiful game, replacing hunches with hard data and empowering fans to become sharp analysts. Think of Opta as football's black box recorder; it captures every meaningful on-pitch action that traditional stats miss, painting a complete picture of the match.
This move from simple observation to in-depth analysis didn't happen overnight. Opta first entered UK football when it was hired by Sky Sports for the 1996-97 season to provide match statistics for their broadcasts. The effect was immediate. The very next season, Opta was named the official statistics provider for the Premier League, cementing its role as a world-leading football data company that now serves clubs, media, and the betting industry. You can discover more about their history and influence here.
From Broadcast Graphics to Betting Gold
The true value of Opta data is its incredible depth. A standard box score might tell you a player scored, but it won't tell you how. Was it an easy tap-in or a spectacular 30-yard strike? Did the player beat three defenders to create the chance? This is the crucial context that Opta provides. Instead of just tracking surface-level events, their analysts log hundreds of different event types in every match, including:
- Passes: Broken down by direction, length, and whether they were successful.
- Defensive Actions: Successful tackles, interceptions, blocks, and clearances.
- Duels: Aerial battles and ground challenges, both won and lost.
- Touches: Highlighting where on the pitch a player is most involved in the action.
The image below, from Opta's parent company Stats Perform, illustrates the rich data ecosystem they have built.

9c4f3b48-7453-40aa-ae7a-ec15885247d0.jpg
It shows how raw on-field events are collected, structured, and then delivered as powerful insights to broadcasters, professional teams, and, crucially for us, betting operators.
The Impact on Modern Football
This detailed information gives everyone, from Premier League managers to sharp bettors, a real advantage. A manager can use Opta player stats to check if a winger is consistently getting the better of their full-back or if a midfielder’s passing is creating genuine forward progress. For bettors, this data is gold. It allows you to see past a misleading scoreline and identify a team that is creating great chances but getting unlucky, or a defence that is starting to look shaky despite a recent clean sheet.
It is the difference between betting on a team because "they're due a win" and backing them because their underlying performance metrics show they are consistently creating high-quality opportunities. This foundation of detailed event data is the bedrock for more advanced predictive metrics, such as Expected Goals (xG).
Expected Goals (xG): The Game-Changer That Makes Sense Of Football
Imagine a metric that acts as football's truth serum, revealing the real story behind every single shot. That’s Expected Goals (xG). Instead of merely counting goals, xG evaluates the quality of each scoring opportunity, assigning it a value between 0.00 (an impossible shot) and 1.00 (a certain goal). It cuts through the noise of lucky deflections and world-class saves to show which teams and players are consistently creating high-value chances. This makes it a foundational tool in modern football analysis, offering a truer measure of performance than the final score alone.
How Opta Determines Shot Quality
So, how is this value calculated? The model from Opta doesn't just guess; it has processed data from hundreds of thousands of historical shots to understand what separates a great chance from a poor one. When a player takes a shot, the algorithm instantly weighs several key variables to produce an xG value:
- Distance and Angle: A shot from six yards out in the center of the goal is far more likely to be scored than a speculative strike from a tight angle near the sideline.
- Type of Pass: A defence-splitting through-ball that results in a one-on-one with the keeper will generate a higher xG than a hopeful cross into a crowded penalty area.
- Body Part: A shot taken with a player's preferred foot is generally more dangerous—and thus has a higher xG—than a header or a shot with their weaker foot.
- Defensive Pressure: The position and number of defenders between the ball and the goal have a major impact on the probability of scoring.
This detailed breakdown provides an objective measure of chance quality for every shot taken in a match.
Separating Luck from Finishing Skill
This is where xG becomes an incredibly powerful tool for analysis. By comparing a player’s actual goal tally to their total xG, we can spot both over-performers and under-performers. For instance, a striker who scores 15 goals from a total xG of 20.0 is under-performing. They are getting into excellent positions but are being wasteful with their finishing. On the other hand, a player who scores 12 goals from an xG of 8.0 is over-performing, converting chances at a rate that may not be sustainable. This isn't just theory; it helps us distinguish truly clinical finishers from those riding a hot streak. To explore this metric further, you can learn more in our detailed guide on Expected Goals.
While xG is focused on goalscoring, it's just one of many Opta player stats that help build a complete profile of a player's abilities. The infographic below shows how other metrics like passing, dribbling, and defensive actions combine to paint a fuller picture of a player’s contribution.
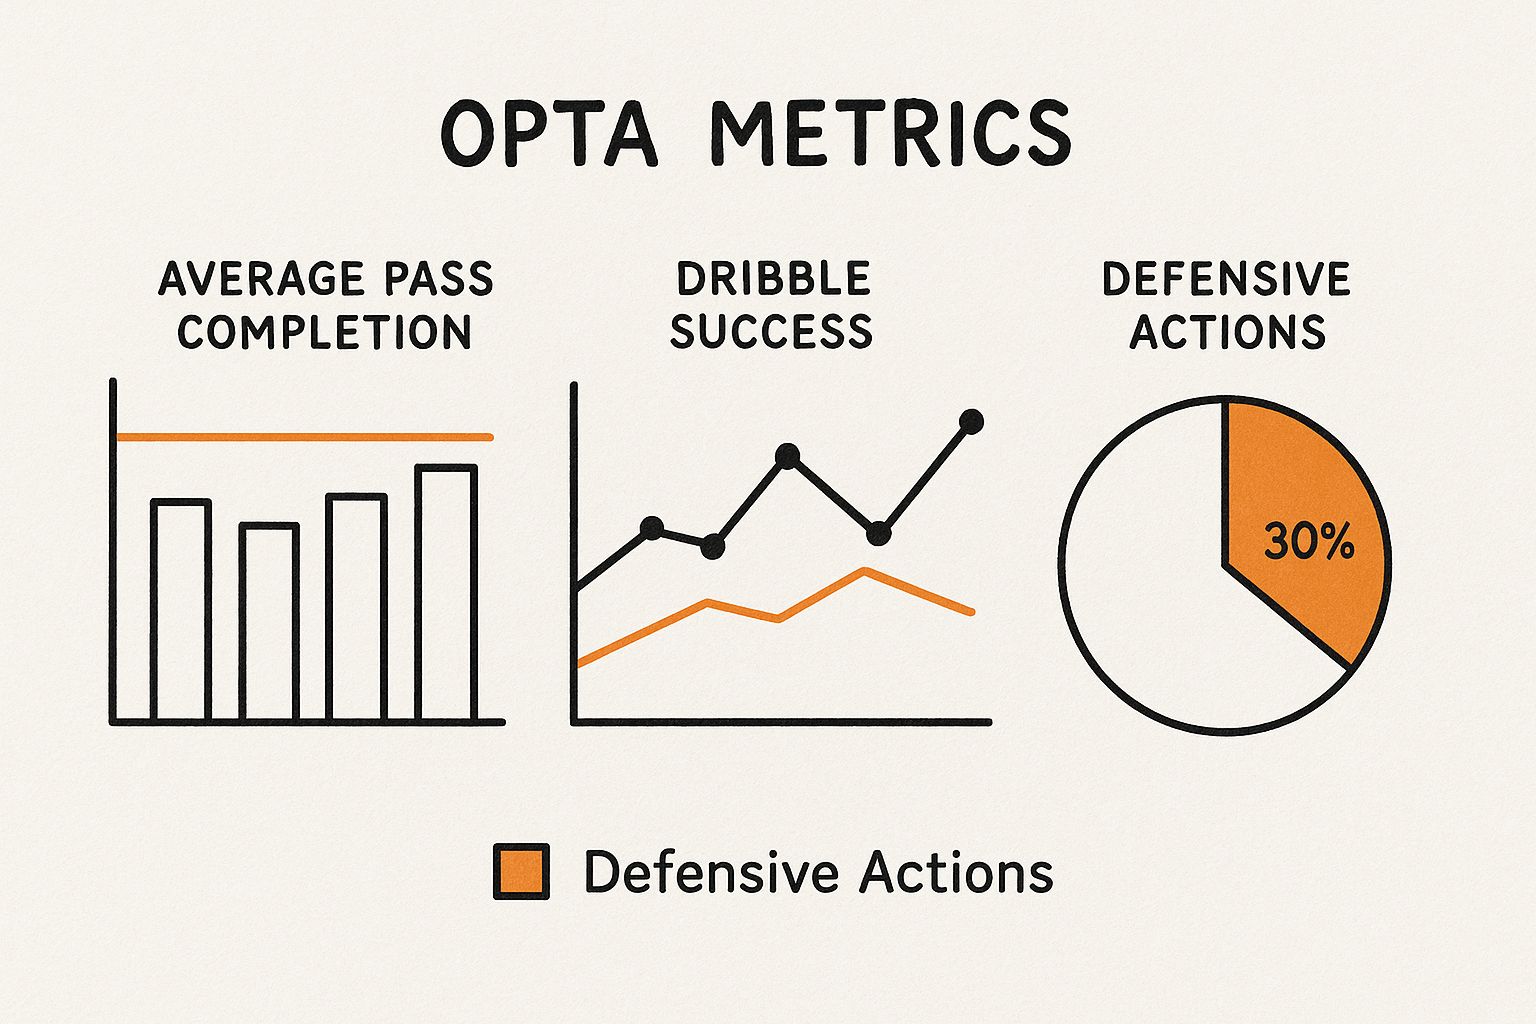
97f5e589-9332-4331-afe7-8e9ee62dbc08.jpg
This visual highlights that a player's overall value is a blend of skills across all phases of the game. To help you better interpret shot quality at a glance, the following table breaks down xG values and what they represent in real-world terms.
A comprehensive breakdown of expected goals values and their real-world interpretation for different shot scenarios
| xG Range | Shot Quality | Typical Scenario | Conversion Rate |
|---|---|---|---|
| 0.01 - 0.05 | Very Low | A long-range shot from 30+ yards with defenders present. | 1% - 5% |
| 0.06 - 0.15 | Low | A headed chance from a cross or a shot from a tight angle. | 6% - 15% |
| 0.16 - 0.40 | Good | A shot from just inside the box with some defensive pressure. | 16% - 40% |
| 0.41+ | Excellent | A one-on-one with the keeper or a tap-in from close range. | 41%+ |
The table makes it clear: a shot's xG value directly translates to its probability of becoming a goal, with anything above 0.40 considered an excellent scoring opportunity.
For bettors, this understanding is a massive advantage. A team that is generating high xG totals in recent matches but failing to score is likely suffering from a run of bad luck or poor finishing. This often points to positive regression, meaning the goals are bound to start flowing soon. Conversely, a team scoring frequently from low-quality chances (and outperforming their xG) may be due for a cooldown. By analyzing Opta player stats like xG, you can identify these trends before the market reacts, finding value where recent scorelines don't tell the whole story.
Expected Assists (xA): Finding Football's Hidden Creative Geniuses
a9cca09d-8ca9-458a-b70a-4866beb4b716.jpg
While goalscorers often steal the spotlight, the true playmakers—the ones who orchestrate attacks—can have their best work missed by traditional stats. This is where Expected Assists (xA) comes in. It shines a light on players who consistently create high-quality chances, separating the truly creative from those who just got a lucky bounce.
Let’s look at a common scenario. Player A makes a simple five-yard sideways pass to a teammate, who then scores an incredible goal from 30 yards out. Player A gets credited with an assist, even though his pass created almost no danger. Now, imagine Player B carves open the defense with a perfect pass, putting his striker one-on-one for a tap-in, but the striker misses. Player B gets zero credit, despite his pass being far more valuable.
Traditional stats reward Player A, but xA correctly identifies Player B as the superior creator. Understanding this difference is crucial when analyzing opta player stats.
How Opta Measures Creative Quality
The logic behind xA is directly tied to the Expected Goals (xG) metric. In short, a player’s xA for any given pass is simply the xG value of the shot that it leads to. If a pass sets up a shot with an xG of 0.50, the passer receives 0.50 xA. This clever method rewards the quality of the opportunity created, not the final result of the shot.
Opta's model analyzes the same key factors as xG, but from the perspective of the pass creator:
- Pass Location: Where the pass ends up is critical. A pass into the six-yard box is worth more than one to the edge of the penalty area.
- Pass Type: A through-ball that splits defenders is valued higher than a hopeful cross into a crowded box.
- Phase of Play: The model distinguishes between chances created in open play and those from set-pieces like corners or free-kicks.
By focusing on the quality of the chance, xA gives us a much more stable and reliable measure of a player’s creative output over time.
Finding Undervalued Playmakers
For bettors and fantasy football managers, this is where the real value of xA emerges. A player with a high xA total but a low number of actual assists is a prime candidate for positive regression. This signals that their teammates are failing to convert high-quality chances, a trend that is statistically unlikely to continue.
This insight allows you to spot undervalued creative players before their assist numbers eventually rise to match their underlying performance. When combined with other creative metrics like key passes and shot-creating actions, which you can find on platforms like StatsHub.com, you can build a complete profile of a player's true influence and gain a significant analytical advantage.
Defensive Metrics: The Hidden Truth About Football's Unsung Heroes
We’ve all heard the old saying: defense wins championships. But how do we actually measure what makes a defender great? For years, the answer was simple: tackles. The player with the most tackles was seen as the best. The reality, however, is often the opposite. A high tackle count can be a major red flag, signaling a player who is constantly out of position and forced into desperate, last-ditch challenges.

d114f01a-717a-4357-9a12-d0c29411b60b.jpg
This is where advanced opta player stats come in, offering a much clearer view. Imagine an elite centre-back whose real talent isn't in spectacular sliding tackles, but in their incredible ability to read the game. They anticipate threats and position themselves so perfectly that the need for a heroic challenge rarely arises. This proactive defending is what separates the good from the great, and it's something only deeper metrics can reveal.
To really understand a defender's contribution, we need to look at a wider range of actions. The table below breaks down some of the most important defensive metrics tracked by Opta and what they reveal about a player's performance.
| Metric | What It Measures | High Value Indicates | Betting Relevance |
|---|---|---|---|
| Tackles | Dispossessing an opponent with a challenge. | Can indicate a busy, all-action style, but may also mean the player is frequently caught out of position. | Context is key. A high number isn't always a positive sign for the team's defensive structure. |
| Interceptions | Cutting out an opponent's pass. | Excellent anticipation, game intelligence, and proactive positioning. | A high number suggests a defender who stops attacks before they start, a valuable but often overlooked skill. |
| Aerial Duels Won % | The percentage of challenges in the air that a player wins. | Dominance in the air, crucial for defending crosses and set-pieces. | Essential for analysing teams that face a lot of long balls or rely on set-piece defending. |
| Blocks | Stopping a shot or cross from reaching its target. | Strong defensive instincts, commitment, and good positioning to get in the way of the ball. | A high number of blocks can signal that a team is allowing too many shots from dangerous areas. |
| Clearances | Kicking or heading the ball away from the defensive goal area. | A necessary action to relieve pressure. | An excessive number of clearances suggests a team is under constant siege and may be defensively fragile. |
As you can see, no single metric tells the whole story. A player's true defensive profile only emerges when you combine these stats, giving you a much richer picture than simply counting tackles. Capturing these detailed actions is a complex process. Discover more about how Opta UK compiles its football data through a sophisticated system that uses both human analysts and AI to log every event on the pitch.
Beyond the Last-Ditch Tackle
The defender’s job has also changed. A modern fullback, for example, is now expected to contribute to the attack as much as they defend. Metrics like progressive carries—defined as carrying the ball at least five metres towards the opponent's goal—are now critical for evaluating their overall impact. A defender with few tackles but high numbers for interceptions and progressive carries is often a cornerstone of a modern, successful team, influencing the game at both ends of the pitch.
Spotting Defensive Vulnerabilities
For bettors, this level of detail is invaluable. A team might appear strong with a series of clean sheets, but their defensive opta player stats could be telling a very different story. If their goalkeeper is making a high number of saves while their defenders are racking up constant blocks and clearances, it suggests their defensive structure is brittle and perhaps a bit lucky.
This is a classic setup for negative regression, where their good fortune is likely to run out. It creates a perfect opportunity to bet against them or on the 'Both Teams to Score' market. By looking beyond the scoreboard and into these metrics, you can identify weaknesses that the general betting public often misses.
Advanced Metrics: Where The Real Insights Hide
The most valuable football insights are rarely sitting on the surface. They are buried in advanced Opta player stats that many people overlook. While goals and assists make for great headlines, the real story of a player's performance is told through metrics that measure process and influence, not just final outcomes. Digging into these details is what separates basic observation from a professional-grade analysis of the game.
Beyond Shots And Goals
Think about a player’s touches in the opposition box. This single stat is often a much better signal of an attacking threat than their total number of shots. A forward who consistently gets on the ball in dangerous areas is a constant headache for defenders, creating chaos and openings even without shooting. It points to a player with sharp movement and an instinct for finding space where it counts.
Likewise, shot accuracy adds critical context to shot volume. A striker who takes ten shots to score one goal might look busy, but the one who scores once from three shots is far more clinical. This simple distinction helps identify efficient finishers versus wasteful players. We can also spot players who drive their team forward with progressive carries, a metric tracking how often a player carries the ball directly toward the opponent's goal. This shows which players are truly advancing the ball, not just passing it sideways.
The Creative And Defensive Underdogs
A high pass completion rate can be deceiving. What really matters for a creative player is their pass completion in the final third. This stat separates the true playmakers trying to pick the lock of a defense from those who just pad their numbers with safe, simple passes. It highlights players brave enough to take risks to create scoring chances.
At the other end of the pitch, defensive pressures applied reveals a player’s work rate and tactical discipline. This is a perfect stat for identifying hard-working forwards or midfielders whose defensive contributions don't show up in traditional tackles or interceptions.
In the Premier League, these stats often explain why elite players like Mohamed Salah are a constant threat. While his headline numbers of 25 goals and 17 assists in a season are incredible, it's the underlying data—the constant pressures, the touches in the box—that explains his consistent impact. See how Premier League leaders stack up with these stats.
Visualising Influence With Heat Maps
One of the best ways to pull all this information together is with positional heat maps. These graphics offer an immediate visual story of where a player impacts the game most. A heat map shows a player’s true role, which can be very different from their listed position on the team sheet.
You might discover that a player listed as a "winger" is actually doing most of their work as a central playmaker, or that a "defensive midfielder" is constantly pushing forward to join the attack. Understanding these tactical realities is fundamental to making sharp judgments about player performance and finding valuable betting angles.
Turning Opta Stats Into Smart Betting Decisions
Understanding the theory behind Opta player stats is one thing, but using that knowledge to make profitable bets is the real prize. The secret lies in finding the gap between a team's underlying performance and what the market thinks of them, an opinion often skewed by recent, misleading scores. This is where you find real value, moving beyond simple form guides to make choices backed by solid data.
The most direct application is spotting teams whose luck is about to run out. Imagine a team on a five-game unbeaten streak. The market loves them. But a look at their Opta stats shows they've been giving up high-xG chances and scoring from low-probability shots. They are over-performing, and this run of good fortune is rarely sustainable. Reality is due to catch up, and their results will eventually match their weaker numbers. These teams are perfect candidates to bet against, especially when they’re priced as heavy favorites.
Finding Value Through Performance Data
On the flip side, the true goldmines are often the teams that the stats love but the league table hates. Picture a club that creates high-quality chances week after week, consistently posting a high team xG, but just can't seem to score. They are doing the hard part right but are being let down by a cold streak in front of goal or facing goalkeepers having the game of their lives. This is a tell-tale sign of a team due for positive regression; their luck is bound to turn.
This creates fantastic betting opportunities. Instead of being scared off by a string of poor results, you can back them with confidence, knowing their process is sound. This data-first approach helps you find an edge where others only see a team in a slump. It’s a great way to identify teams that might overcome a goal deficit. For a closer look at this kind of wager, you can check out our guide on handicap betting in football.
Beyond Team Bets: Player-Specific Angles
This analytical method isn't just for team results. You can apply the same logic to player performance markets with great success.
- Shots on Target: Is a top striker underperforming his individual xG? He’s likely getting into all the right spots but is in a scoring drought. This player is often a strong bet in the ‘Shots on Target’ market, as he’ll be determined to shoot his way back into form.
- Player to be Carded: You can spot potential bookings by examining a player's fouls committed data against the number of dribbles their direct opponent typically attempts. A foul-prone defender facing a tricky winger is a recipe for a yellow card.
- Assists Markets: A creative midfielder who consistently posts a high xA (Expected Assists) total but has few actual assists to his name is a prime candidate for the assists market. His teammates are due to start finishing the chances he’s creating for them.
Creating a Practical Betting Framework
The key is to avoid getting lost in the numbers, a common trap known as analysis paralysis. You don't need to track every single metric. Instead, build a simple framework by combining a few key Opta player stats. For instance, when looking for a clean sheet bet, don't just focus on a team's recent goals conceded. Dive deeper into their defensive metrics: are they preventing shots from high-xG locations? This is a much more reliable signal of their true defensive solidity.
By layering these insights—team xG trends, individual player stats, and specific defensive numbers—you stop guessing and start making informed predictions. This methodical process helps you cut through the noise, sidestep common betting mistakes, and consistently find opportunities that the rest of the market has overlooked.
Your Complete Opta Analysis Framework
Knowing what xG means is one thing, but consistently turning Opta player stats into winning bets requires a plan. Think of it like a recipe: having the ingredients is great, but you need a step-by-step method to bake the perfect cake. A solid framework stops you from drowning in data and helps you build a clear picture of a match before you risk any money.
Building Your Analytical Foundation
Before you get into the complex details, you need to set the scene. Start by looking at a team's basic performance over their last 5-10 games. This gives you a baseline for their current form. Are they scoring a lot? Are they conceding easily?
Once you have that broad picture, you can start layering in the advanced stats. Compare their actual goals scored to their Expected Goals (xG). This tells you if they've been lucky or are genuinely creating high-quality chances. Do the same for their creative players using Expected Assists (xA) to see if their playmaking is sustainable. This layering approach builds a strong, evidence-based view.
Context Is Everything: Weighting Metrics
Stats don't exist in a vacuum. A stat that's crucial for one player might be meaningless for another. You wouldn't judge a goalkeeper on their dribbling success, and the same logic applies across the pitch.
For a centre-back playing in a team that sits deep, stats like aerial duels won and interceptions are vital. For a tricky winger in an attacking side, you’d focus more on take-ons and touches in the opposition box. Always think about the team’s tactical style. A defender in a high-pressing team will naturally have different numbers than one in a low block, so context is always king.
A Practical Pre-Match Checklist
To keep your analysis sharp and consistent, a simple checklist can be your best friend. It ensures you cover the most important angles for every single match. Here is a simple but effective template to guide your research:
- Team Performance vs. Expectation: Are the team's recent wins or losses backed up by their xG and xGA (Expected Goals Against)? Look for teams that are either overperforming or underperforming their stats, as they could be due for a change in fortune.
- Key Player Form: Dig into the recent Opta player stats for the most influential players. Is the star striker getting plenty of shots off? Is the main playmaker creating chances (xA)? Is a key defender looking shaky?
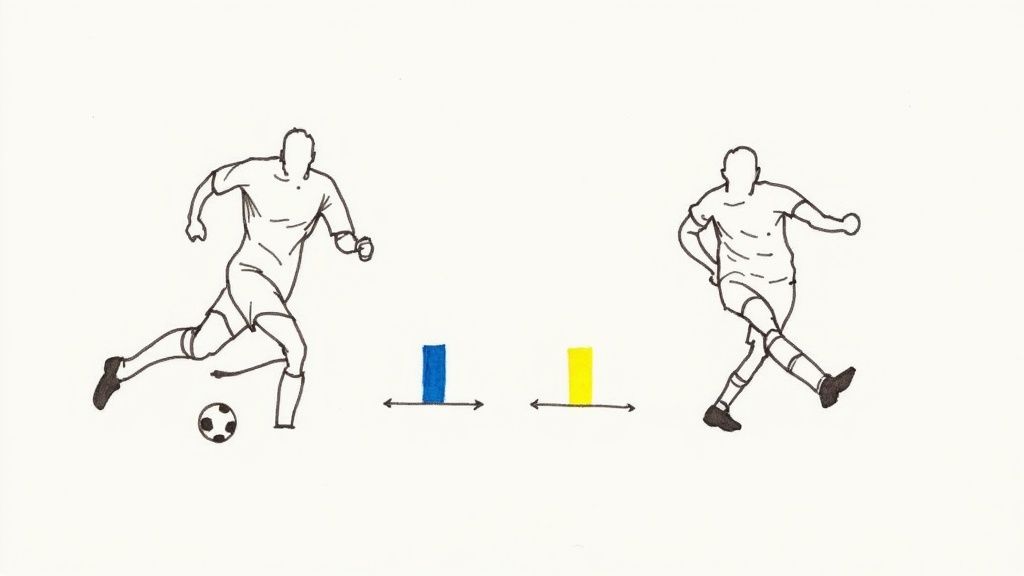
- Positional Matchups: Where are the key one-on-one battles? A winger with a high dribble success rate going up against a fullback who commits a lot of fouls is a great spot to look for value in the player card or fouls markets.
- Set-Piece Threat: Don't forget dead-ball situations. Check a team’s xG from set-pieces to find hidden strengths or weaknesses that the market often ignores.
Putting this framework into action is straightforward. You can find all the player and team data you need for this kind of analysis for free on StatsHub.com. It has the tools to help you apply this approach and start making more informed, data-driven betting decisions.